How to Test Moscow VPS Latency Before Deployment
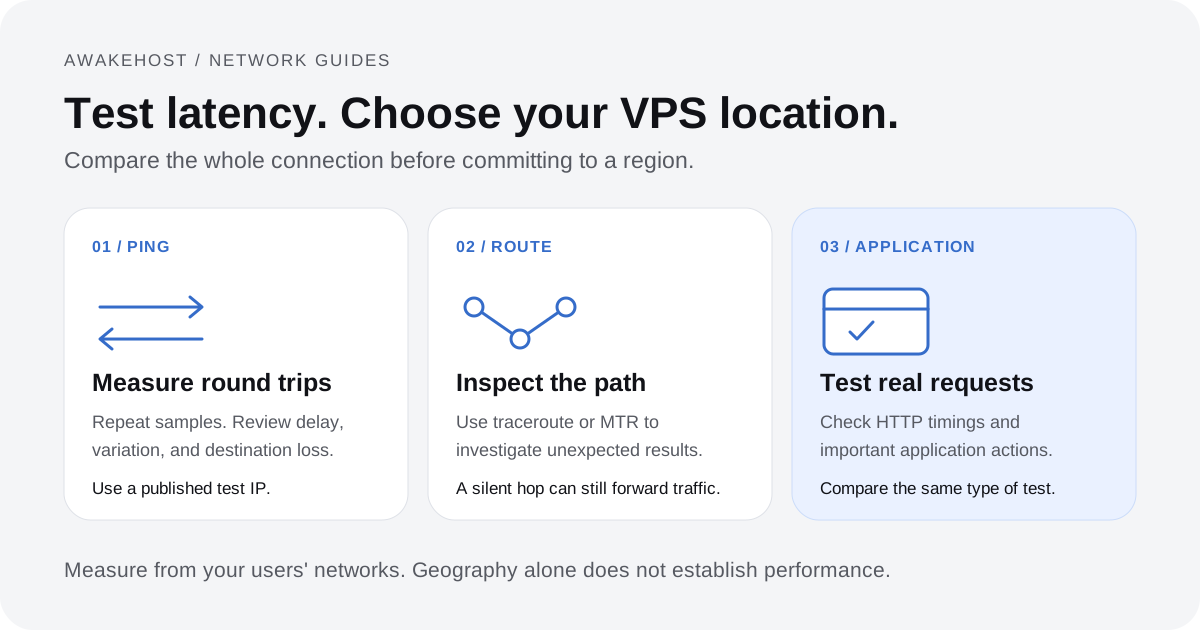
A Moscow VPS can put an application in Russia, but the city name does not tell you how quickly your users can reach it. The route from a particular broadband, mobile, or office network can matter as much as the distance on a map.
This guide shows how to collect a repeatable set of ICMP measurements against AwakeHost's published Moscow test address before comparing Russia VPS plans. It provides a testing method, not a benchmark or a latency promise. No representative multi-network measurements are published here.
Find the current Moscow test address
Open the AwakeHost Network Looking Glass and select Russia / Moscow. Its published IPv4 test target is 130.94.90.217. The command examples below use the same address as the site's location registry.
A Moscow IPv6 test address is not published. Browser HTTP latency testing is not enabled for Moscow. The manual IPv4 target is available independently of that browser feature; opening the Looking Glass does not start a ping or a speed download.
A result describes the connection to this test address at the recorded time. It does not certify the performance of every Moscow VPS, an assigned customer IP, or the application you will install.
Record the source and test conditions
Test from the places that matter to the application: a representative user connection, a mobile network, and the network your administrators use. For international buyers, an overseas office route and a Russian audience route answer different questions.
- Record the source city, country, network operator or ASN, and whether the connection is wired, Wi-Fi, or mobile.
- Record VPN or proxy use. Keep separate runs for direct and VPN connections instead of mixing the samples.
- Record the destination IPv4, operating system, tool version, packet size, and sample count.
- Save start and end timestamps with a time zone, preferably UTC. Keep the raw output for each run.
- Repeat at a busy time and a quieter time. Keep each run separate so changes remain visible.
Use the same packet size and sample count when comparing runs. Close large downloads on your own connection, and note competing traffic you cannot control.
Collect 50 ICMP ping samples
On Linux or macOS, run the following in a terminal. The 56-byte payload makes the sample size explicit; -n keeps output numeric. The timestamps bracket the saved run.
date -u '+%Y-%m-%dT%H:%M:%SZ'
LC_ALL=C ping -n -c 50 -s 56 130.94.90.217 > moscow-ping.txt
date -u '+%Y-%m-%dT%H:%M:%SZ'
On Windows, use PowerShell. The matching payload is selected with /l 56 and the count with /n 50.
(Get-Date).ToUniversalTime().ToString('o')
ping.exe /4 /n 50 /l 56 130.94.90.217 | Out-File -Encoding utf8 moscow-ping.txt
(Get-Date).ToUniversalTime().ToString('o')
These commands send 50 ICMP echo requests; they do not test download throughput. Inspect the saved file before using the results. If the tool cannot run or the target does not reply, record that outcome rather than inventing a zero-millisecond measurement.
Calculate packet loss, median and p95
The ping summary reports sent and received packets. Calculate packet loss as 100 × (sent − received) / sent. Keep the counts as well as the percentage. No replies means no measurable round-trip latency for that run; it does not prove the server is down, because ICMP may be filtered or rate-limited.
For latency, take one round-trip time from each successful reply line. Do not include the summary statistics as extra samples, and do not replace lost packets with zero.
- Sort the successful reply times from lowest to highest, preserving repeated values.
- The median is the middle value when the count is odd, or the average of the two middle values when it is even.
- For p95, use the nearest-rank method: take the value at position
ceil(0.95 × successful replies), counting from one. With 50 replies, that is the 48th sorted value.
Report the number of successful replies beside median and p95. A p95 based on a small sample is a snapshot, not a service guarantee. If the tool displays a bound such as <1 ms, retain the bound or use a tool with greater precision; do not silently convert it to zero.
Use one record per run. The following is a field template, not a set of measured results:
started_at_utc,ended_at_utc,source_city,source_country,source_network,connection_type,vpn_state,destination_ipv4,protocol,payload_bytes,sent,received,loss_percent,median_ms,p95_ms,raw_output_fileUse ICMPv4 for these commands. Leave median and p95 unavailable if there are no successful samples. Keep raw logs internally; public summaries need enough source and method detail to be reproducible without exposing unrelated account or network information.
Inspect the route with traceroute
When results differ between source networks, a numeric traceroute can help show where their paths diverge. Run it separately from the ping sample.
# Linux or macOS, when traceroute is installed
traceroute -n 130.94.90.217

# Windows
tracert /d /4 130.94.90.217
Record the command and platform because default probe protocols differ. An asterisk or a slow intermediate hop can reflect a router's treatment of diagnostic packets. It does not by itself establish packet loss or the cause of a slow application. Examine the destination response and repeat from another network.
Test your application before moving traffic
ICMP round-trip time leaves out DNS, TLS, web-server processing, database queries, and external API calls. After provisioning, test the actual application and its assigned address with representative data, authentication, uploads, scheduled jobs, and dependencies.
Compare application timings separately from ICMP. Confirm external service access from the deployment environment; those providers set their own availability and access rules. Keep a rollback environment and an off-server backup before moving production traffic.
Return to the Moscow resource comparison to check storage, memory, compute, and transfer together. A faster route cannot compensate for a workload that exceeds its server resources.
Command references: iputils ping documentation and Microsoft ping documentation. On macOS, check man ping and man traceroute for the installed tools.